rm(list = ls())
library(ggplot2)
# create data
x <- c(8,7,6,7,6,5,6,5,4,5,4,3,4,3,2,3,2,1,0.5,0.1)
dat1 <- data.frame(x1 = 1:length(x), x2 = x)
dat2 <- data.frame(x1 = 1:length(x), x2 = -x)
dat1$xvar <- dat2$xvar <- NA
dat1$yvar <- dat2$yvar <- NA
dat1$siz <- dat2$siz <- NA
dat1$col <- dat2$col <- NA
# set threshold for christmas balls
dec_threshold = -0.5
# create random places, sizes and colors for christmas balls
set.seed(2512)
for (row in 1:nrow(dat1)){
if (rnorm(1) > dec_threshold){
dat1$xvar[row] <- row
dat1$yvar[row] <- sample(1:dat1$x2[row]-1,1)
dat1$siz[row] <- runif(1,0.5,1.5)
dat1$col[row] <- sample(1:5, 1)
}
if (rnorm(1) > dec_threshold){
dat2$xvar[row] <- row
dat2$yvar[row] <- sample(1:dat2$x2[row],1)
dat2$siz[row] <- runif(1,0.5,1.5)
dat2$col[row] <- sample(1:5, 1)
}
}
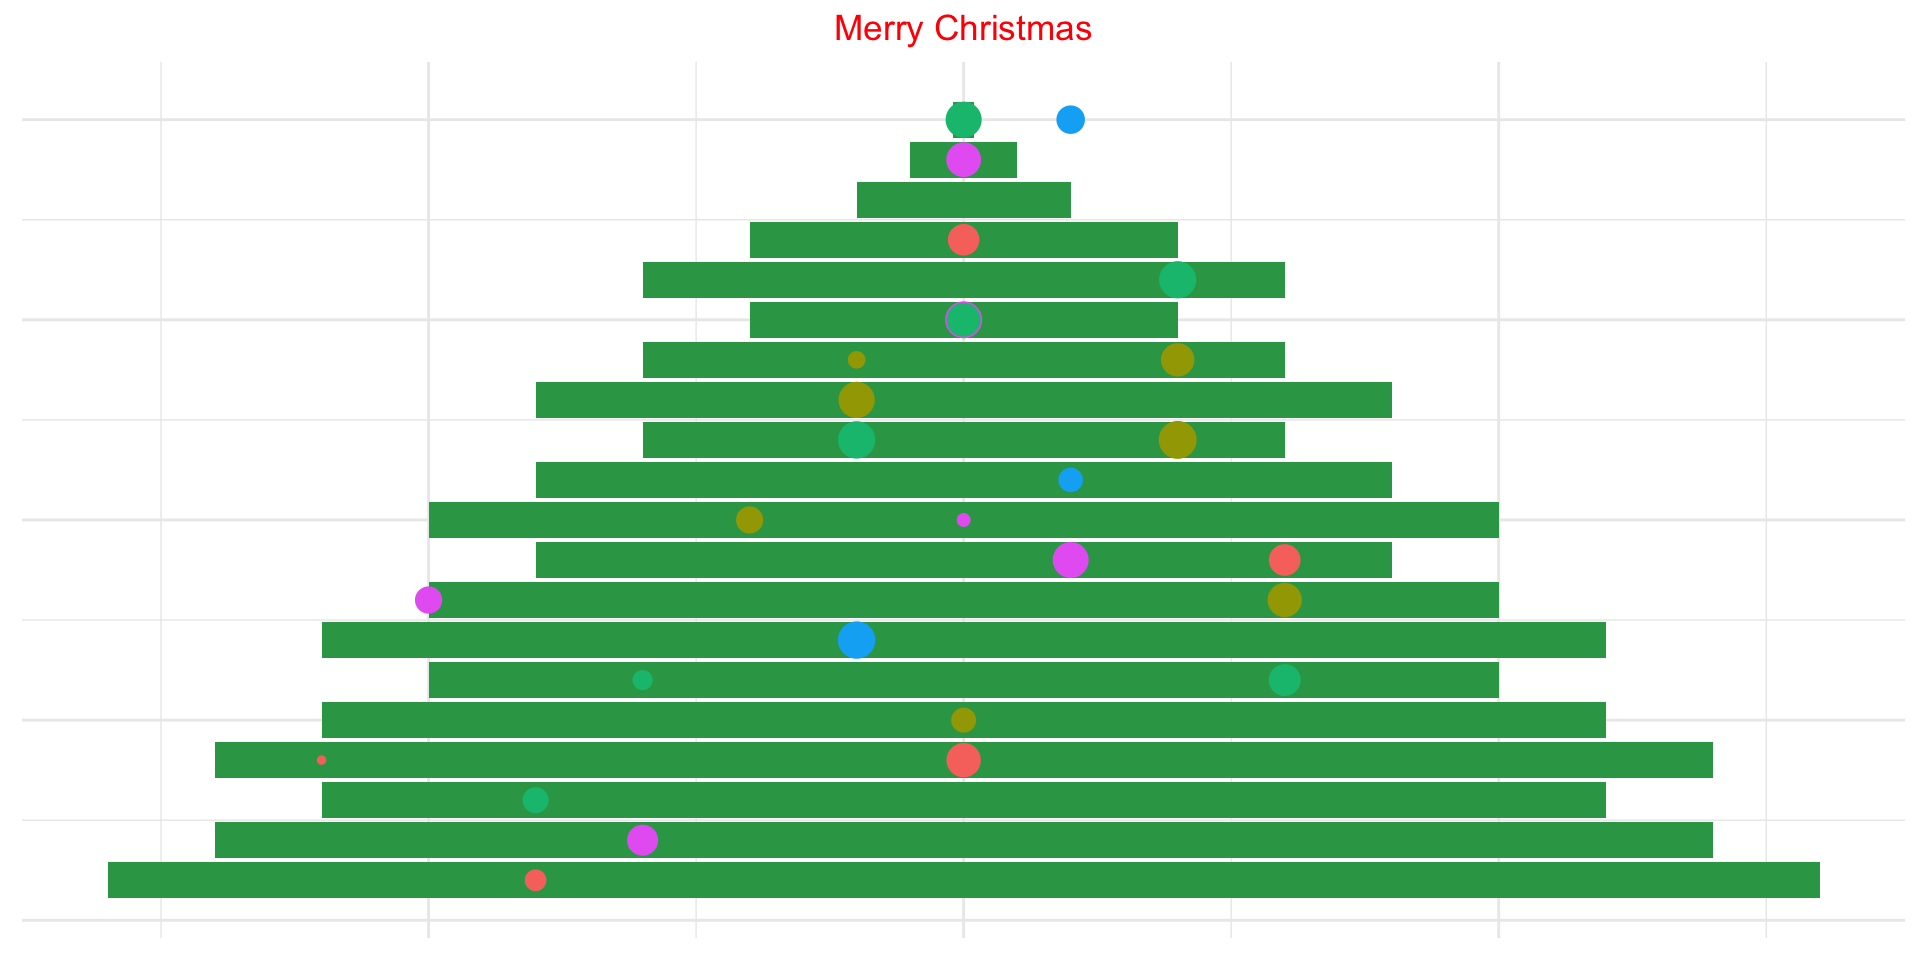
# plot the christmas tree
ggplot() +
geom_bar(data = dat1, aes(x=x1, y=x2),stat = "identity", fill = '#31a354') +
geom_bar(data = dat2, aes(x=x1, y=x2),stat = "identity", fill = '#31a354') +
geom_point(data = dat1,aes(x = xvar, y = yvar, size = siz, colour = as.factor(col)) ) +
geom_point(data = dat2,aes(x = xvar, y = yvar, size = siz, colour = as.factor(col)) ) +
coord_flip() + theme_minimal()+ theme(legend.position="none",
axis.title.x=element_blank(),
axis.text.x=element_blank(),
axis.ticks.x=element_blank(),
axis.title.y=element_blank(),
axis.text.y=element_blank(),
axis.ticks.y=element_blank()) +
ggtitle('Merry Christmas') +
theme(plot.title = element_text(color = "red", hjust = 0.5))